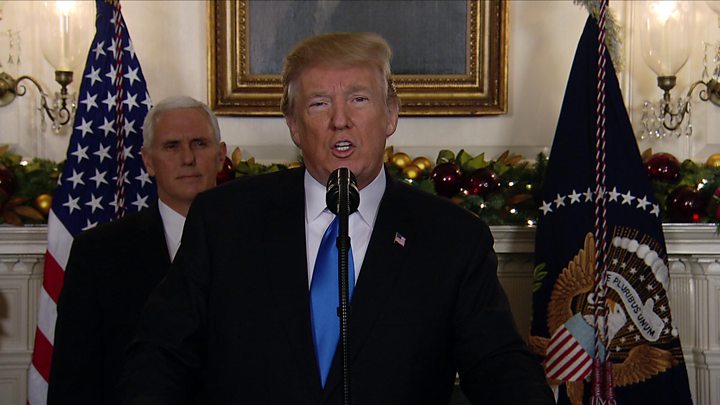
A special Roy Morgan SMS Survey taken on December 14-15 shows a large 76% of Australians opposed to US President Donald Trump’s decision to declare Jerusalem the capital of Israel with only 24% of Australians expressing support for Trump’s decision earlier this week.
Australian’s have similar views to New Zealanders with a large majority of 75% of New Zealanders also opposing Trump’s decision to declare Jerusalem the capital of Israel while 25% of New Zealanders supported the decision.
This special Roy Morgan SMS Survey was conducted on December 14-15, with a cross-section of 1,153 Australians aged 18+.
Should Jerusalem be the capital of Israel?
“Do you support or oppose President Trump’s recent decision to declare Jerusalem the capital of Israel?”
Analysis by Age & Gender: Women more opposed than men to Jerusalem as Israeli capital
Many more women (82%) than men (69%) oppose US President Donald Trump’s decision to declare Jerusalem the capital of Israel. Only 18% of women and 31% of men support the decision.
Analysing by age group shows respondents of all age groups strongly oppose Trump’s decision. 83% of 18-24 year olds, 75% of 25-34yr olds, 78% of 35-49yr olds, 76% of 50-64yr olds and 68% of those aged 65+ oppose the decision.
| Total
Australia |
Gender | Age | Total
NZ |
||||||
| Men | Women | 18-24 | 25-34 | 35-49 | 50-64 | 65+ | |||
| % | % | % | % | % | % | % | % | % | |
| Support | 24 | 31 | 18 | 17 | 25 | 22 | 24 | 32 | 25 |
| Oppose | 76 | 69 | 82 | 83 | 75 | 78 | 76 | 68 | 75 |
| TOTAL | 100 | 100 | 100 | 100 | 100 | 100 | 100 | 100 | 100 |
Analysis by States & Regions: Southern States (Vic, SA, Tas) more opposed than others
Analysing by States shows residents of the southern States of Victoria, South Australia and Tasmania are more likely to oppose Donald Trump’s decision (all 83%) than the other states. The other States, New South Wales (74%), Queensland (69%) and Western Australia (68%) opposed the decision also.
| States | City/ Country | |||||||||
| Total
Australia |
NSW | VIC | QLD | WA | SA | TAS | City | Country | Total
NZ |
|
| % | % | % | % | % | % | % | % | % | % | |
| Support | 24 | 26 | 17 | 31 | 32 | 17 | 17 | 23 | 27 | 25 |
| Oppose | 76 | 74 | 83 | 69 | 68 | 83 | 83 | 77 | 73 | 75 |
| TOTAL | 100 | 100 | 100 | 100 | 100 | 100 | 100 | 100 | 100 | 100 |
Analysis by Fed. Voting Intention: Greens & Labor supporters more opposed than L-NP supporters
Analysing responses by federal voting intention shows supporters of the Greens (96%) and Labor (88%) are far more likely to oppose Donald Trump’s decision to declare Jerusalem the capital of Israel than supporters of the L-NP 59%. L-NP support for the decision is 41% which is more than double supporters of Labour and the Greens.
| Total
Australia |
Electors | L-NP | Labor | Greens | Other | Can’t say | Non electors | Total
NZ |
|
| % | % | % | % | % | % | % | % | % | |
| Support | 24 | 23 | 41 | 12 | 4 | 21 | 12 | 28 | 25 |
| Oppose | 76 | 77 | 59 | 88 | 96 | 79 | 88 | 72 | 75 |
| TOTAL | 100 | 100 | 100 | 100 | 100 | 100 | 100 | 100 | 100 |
Michele Levine, Chief Executive Officer, Roy Morgan, says:
“Australians have comprehensively rejected US President Donald Trump’s decision earlier this week to declare that the US recognises Jerusalem as Israel’s capital city with over three-quarters of Australians, equal to 76% of respondents, indicating they oppose Trump’s controversial decision and only 24% in support.
“As one might expect L-NP supporters are the most evenly split on the issue – although there is still a clear majority of 59% of L-NP supporters who oppose Trump’s decision, but this is well behind the 88% of Labor supporters and 96% of Greens supporters that oppose.
“Opposition to Trump’s decision is unanimous across all age groups – although the strongest opposition comes from those aged 18-24 at 83%, opposed clearly by both genders and in every Australian State. Trump’s decision is also opposed in almost equal measure across the Tasman with 75% of New Zealanders indicating their opposition.”
Refer to the poll result report from Roy Morgan.

